

Trying to decipher the Federal Reserve
Raymond James Chief Economist Eugenio J. Alemán discusses current economic conditions.
This week's Federal Open Market Committee (FOMC) decision was largely in line with expectations. While many market participants and Federal Reserve (Fed) members anticipated another rate increase later this year, we remained in the camp that viewed the move as likely the last increase before the Fed adopted a wait-and-see approach, allowing geopolitical developments to stabilize and recent inflationary base effects related to the US-Iran war to fade.
What was less expected was the degree of uncertainty created by the updated Summary of Economic Projections (SEP), the dot plot and the chairman's press conference. Although we understand the chairman's intention to reduce reliance on explicit forward guidance, eliminating guidance while simultaneously publishing the SEP and dot plot, and then distancing himself from those projections during the press conference, risks complicating rather than simplifying monetary policy communication. Under an inflation-targeting framework, clarity regarding the policy reaction function remains essential.
The chairman argued that the Fed continues to remove monetary accommodation. Yet many measures suggest that monetary policy was already restrictive prior to the latest rate increase.
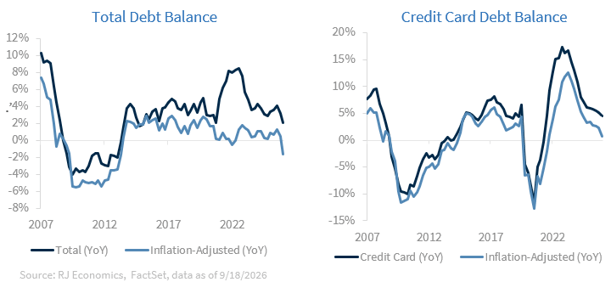
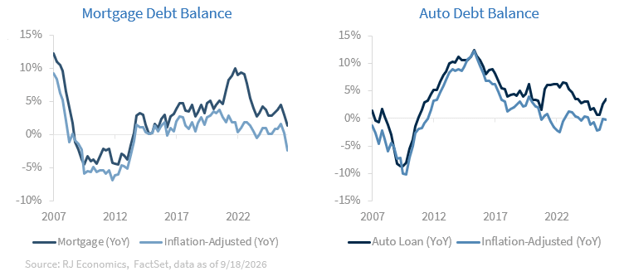
Household balance sheets provide one example. Total household debt has increased only modestly in nominal terms and has declined in real terms over the past year. This pattern is evident across most major categories. Credit card balances have risen in nominal terms but are essentially flat after adjusting for inflation, while mortgage and auto debt have posted outright declines in real terms. Rather than leveraging up, households continue to deleverage, a dynamic more consistent with restrictive financial conditions than accommodative monetary policy.[1]
At the same time, household financial conditions remain relatively healthy. Measures of household financial soundness, particularly relative to income, do not suggest excessive financial stress despite elevated borrowing costs.
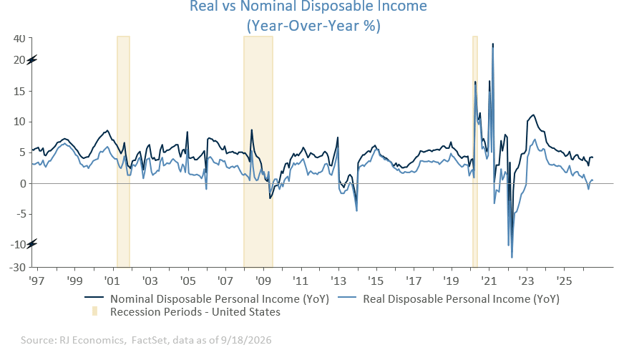
The income side of the household balance sheet, however, remains subdued. Growth in both nominal and real disposable personal income has been weak on a year-over-year basis. Historically, such softness has been more characteristic of periods surrounding economic downturns than of an economy expanding above potential. The disconnect helps explain why many households have not fully participated in the benefits of the current expansion, a reality reflected in both consumer sentiment and consumer confidence measures.
What about the credit market?
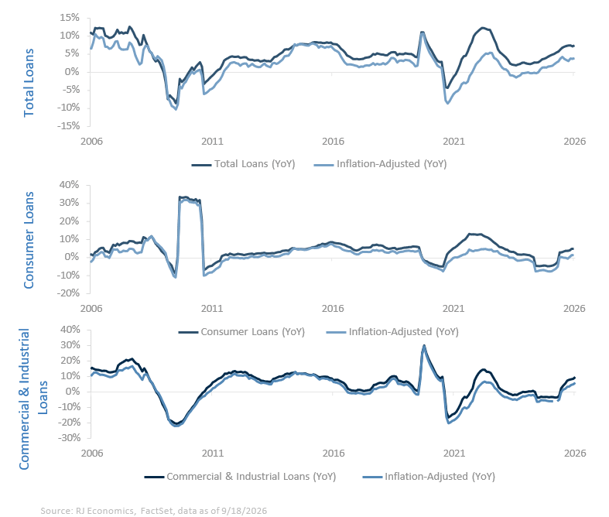
The credit markets tell a similar story. While some lending categories have strengthened, the overall picture remains inconsistent with the notion of accommodative monetary policy.
Commercial bank lending has recovered from an extended period of exceptionally weak growth. Both nominal and real loan growth have moved back into positive territory, but the pace remains modest by historical standards. More importantly, the improvement has been concentrated in commercial and industrial lending rather than consumer credit.
Much of this strength reflects investment activity tied to manufacturing expansion, federal incentives embedded in the CHIPS and Inflation Reduction Act legislation, and continued spending associated with artificial intelligence and data center construction. These developments point to sector-specific investment demand rather than broad-based credit-driven economic overheating.
Meanwhile, the real estate sector continues to face challenges. Residential housing activity remains constrained by elevated financing costs, while commercial real estate has shown only limited improvement. Although commercial real estate lending has stabilized in nominal terms, activity remains essentially flat after adjusting for inflation.
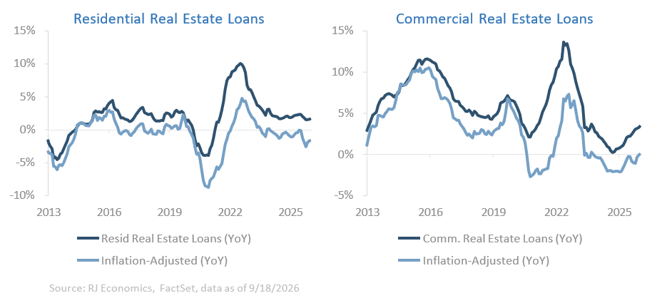
Taken together, the credit data suggest that credit is flowing selectively through the economy rather than fueling a generalized inflationary cycle. Current inflation pressures appear more closely linked to higher tariffs and elevated energy prices than to monetary accommodation.
Consumer spending has remained resilient, but that resilience does not appear to be driven by increased borrowing. Instead, higher-income households continue to benefit from gains in financial assets, allowing consumption to remain firm despite restrictive interest rates.
Returning to the Fed’s decision
Our greatest concern stemming from this week's meeting involves the apparent disconnect between the SEP and the chairman's interpretation of it.
The September SEP indicates that inflation is not expected to return to the Fed's 2% objective until 2029. We have consistently argued that the fact inflation has remained above target for several years is largely irrelevant for current policy decisions. What matters is identifying the policy stance required to achieve and sustain 2% inflation over the long run.
The SEP's projections suggest that achieving that objective will take several more years. Yet during the press conference, the chairman appeared to dismiss the 2029 timeline, implying that inflation could return to target sooner.
We find that difficult to reconcile with the Fed's own projections. Absent another significant inflation shock, we believe inflation could plausibly return to target in late 2028 or early 2029, broadly consistent with the SEP, even if interest rates had remained unchanged after the September meeting.At the same time, the Fed now projects one additional rate increase in 2026, raising the federal funds rate to a range of 4.00% to 4.25%. Yet the SEP also projects stronger economic growth in both 2026 and 2027 than was anticipated in June. If growth is expected to accelerate despite higher rates, then the projected tightening appears insufficient to materially alter the economy's trajectory.
The implication is straightforward: Barring a much more restrictive path for interest rates than currently reflected in the dot plot, the probability of achieving the inflation target meaningfully earlier than projected remains low. That raises an important question for investors and policymakers alike: What exactly is the chairman's reaction function?
1We typically like to look at these series in real terms, that is, taking inflation out of the equation, to see what is happening to these series without the distortion from inflation. In the graph we include both, year-over-year changes in nominal and real debt levels.
Economic and market conditions are subject to change.
Opinions are those of Investment Strategy and not necessarily those of Raymond James and are subject to change without notice. The information has been obtained from sources considered to be reliable, but we do not guarantee that the foregoing material is accurate or complete. There is no assurance any of the trends mentioned will continue or forecasts will occur. Past performance may not be indicative of future results.
